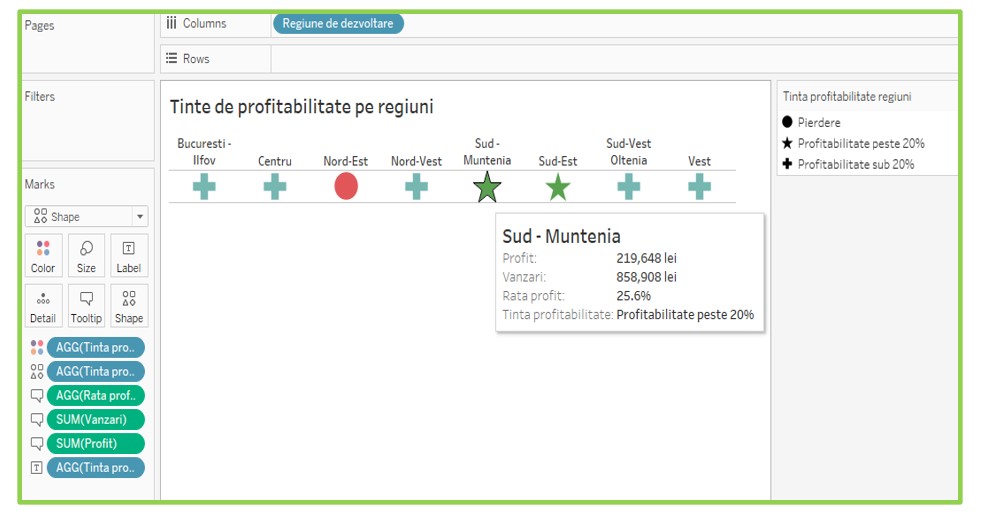
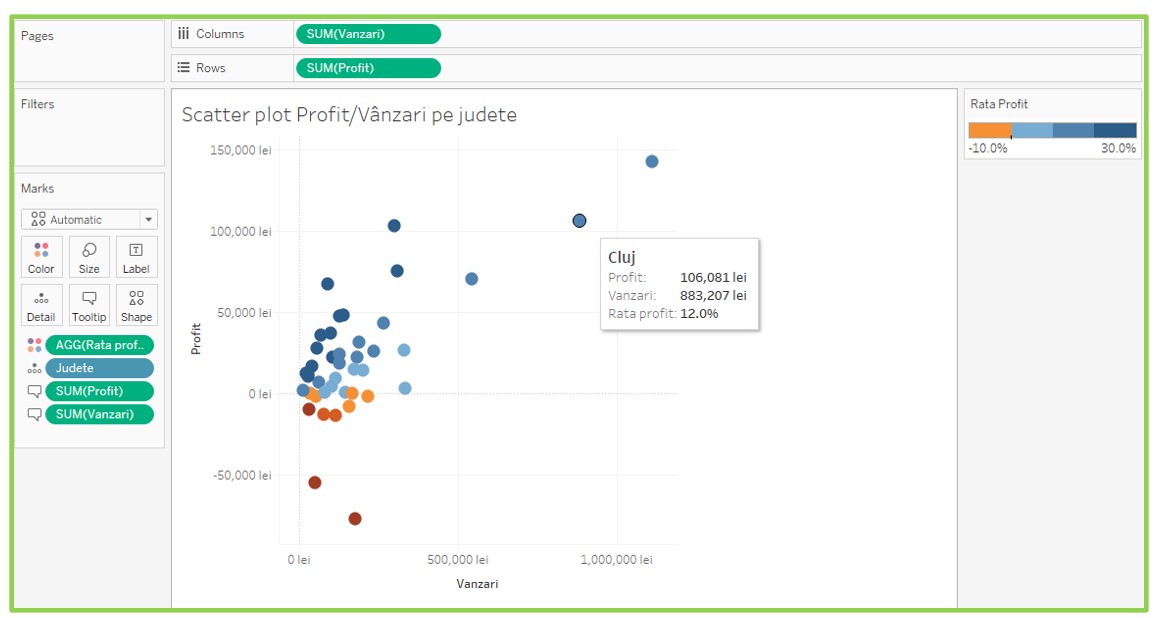
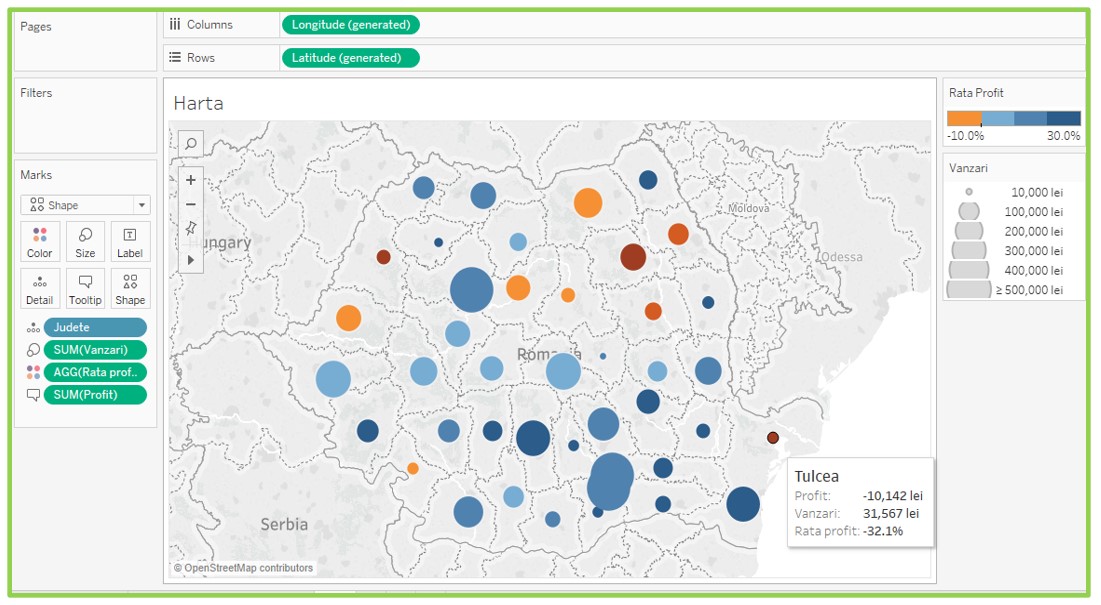
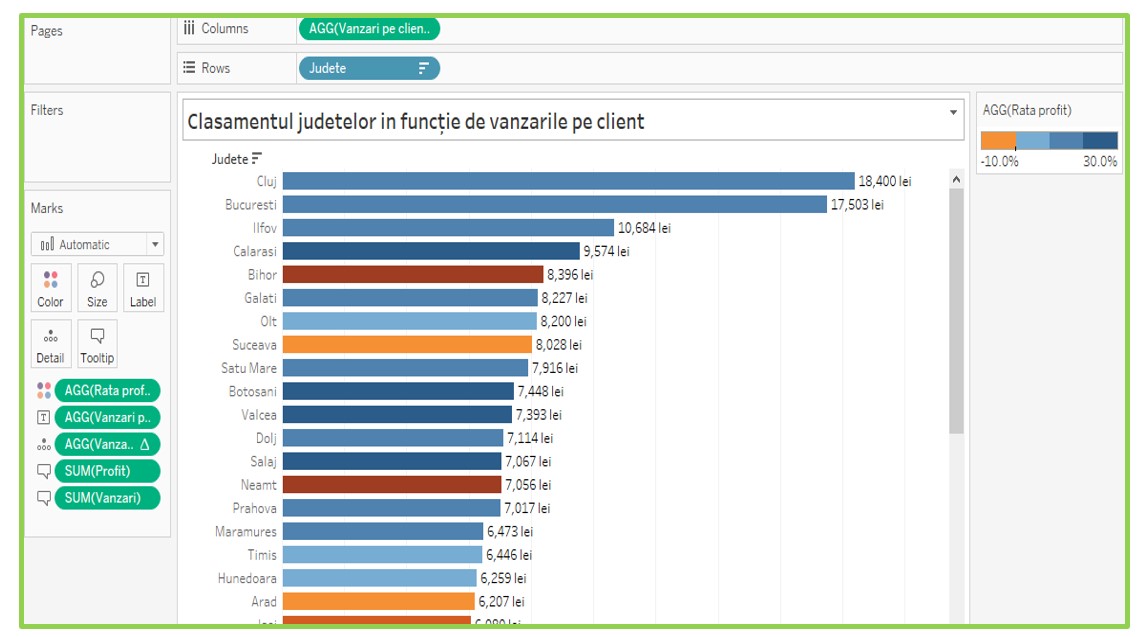
Design principles of a dashboard
It is advisable that the dashboard design should focus on only a few design principles that will be followed
A. Compact design / Modular design
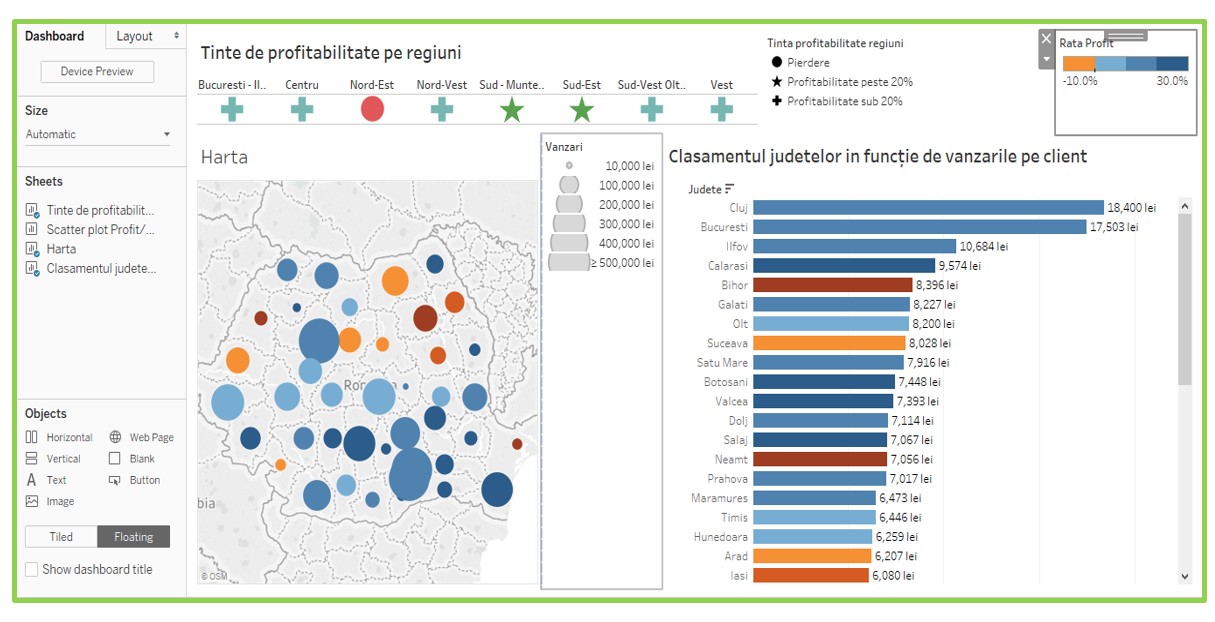
The compact nature of a dashboard means that the visualization can be comprehended by the human brain
Some dashboards become too large and difficult to follow in an effort to include as much information as possible
Dashboards can be divided into smaller pieces, each of which answers a question.
B. Gradual Disclosure of Information.
Information is disclosed as the user expresses interest.
The user is not overwhelmed from the start with all the information
Increasing the level of detail is generally done from:
Key indicators à
The context of the indicators à
Details on indicators
Design principles of a dashboard
C. Guidance of attention
Using visual cues and functionality to direct the user's attention to the most important things
Among the mechanisms that can be used are: alerts, positioning on the page, careful use of color and fonts.
D. Support for ease of use
Avoiding overloading the view, minimizing the number of actions for each task so that new users are encouraged to use the view
Providing clear and concise descriptions of what the items on the dashboard mean.
E. The possibility of personalization
Ensuring the flexibility to make the dashboard relevant to different users.
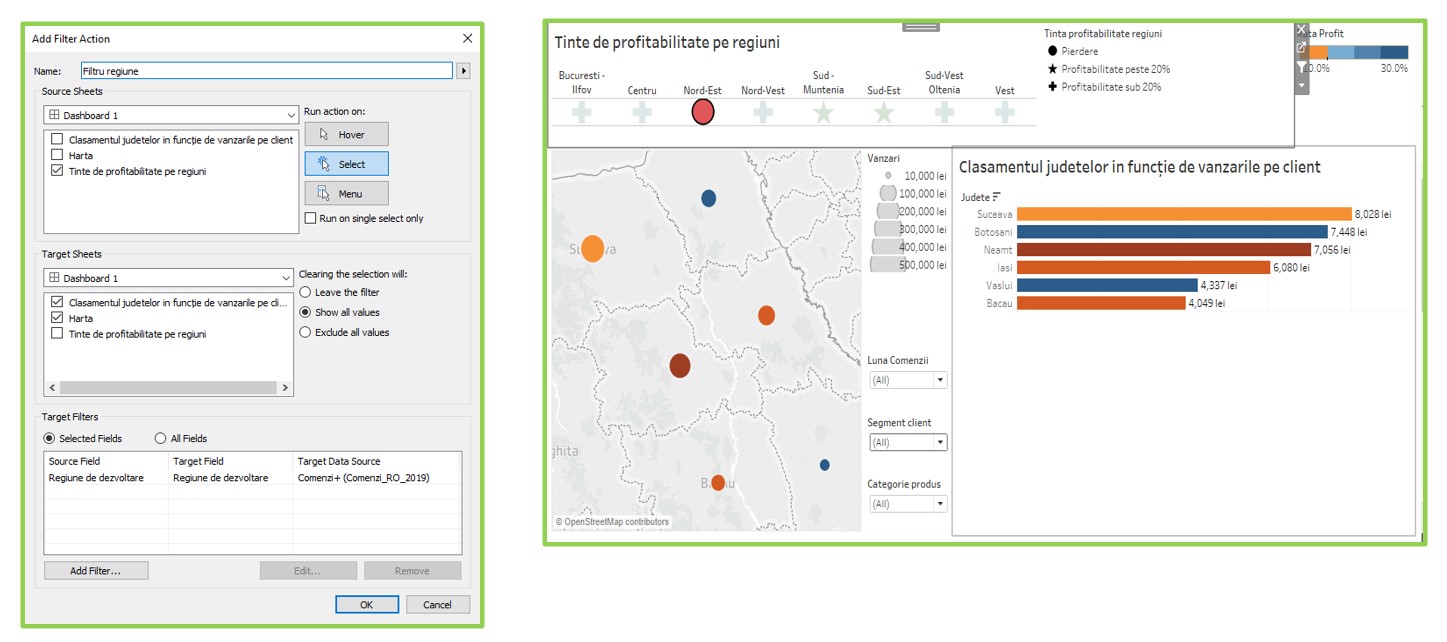
It is generally done by using filters
F. Explanations Before Information
Where context and explanations are needed to understand new and unfamiliar events
Sometimes leaving the interpretation of data up to the user can lead to wrong conclusions and confusion.
Elements that ensure the functionality of a dashboard
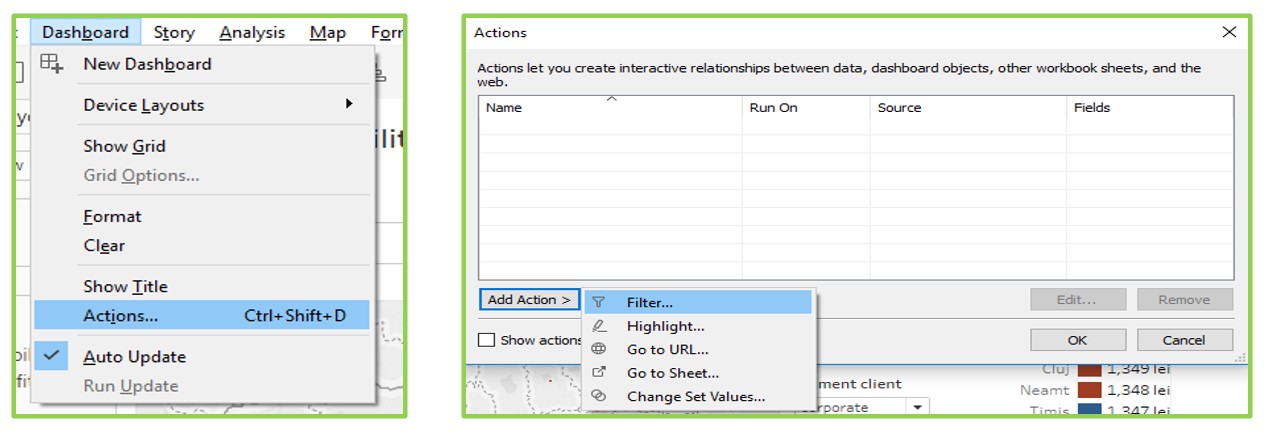
Ability to detail
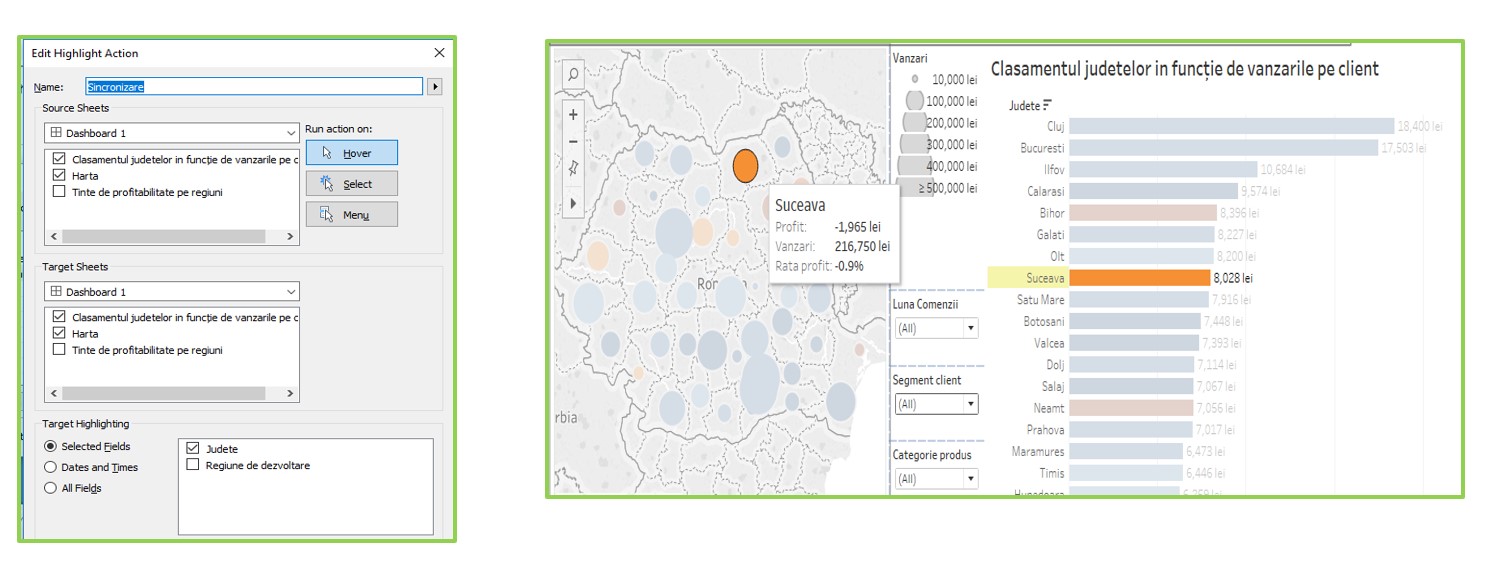
The ability to move from a summary indicator or representation to indicators that provide more detail, more context on the information
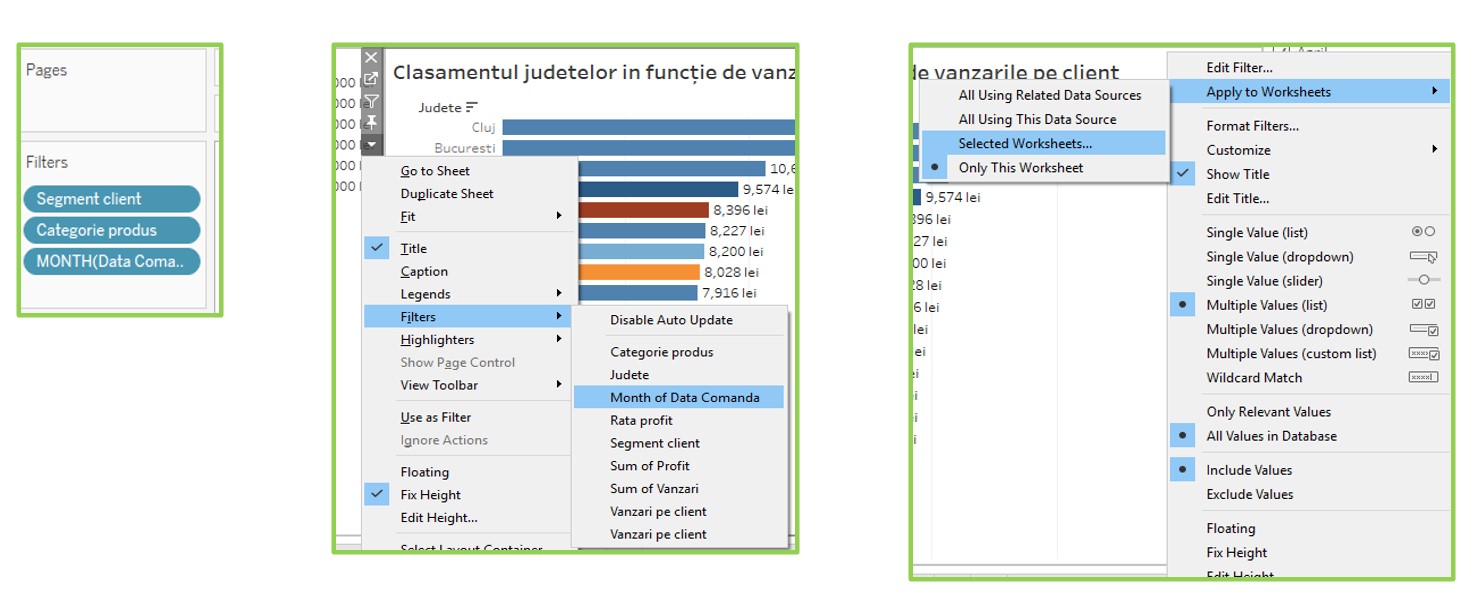
Filters
It allows users to define what is displayed in the dashboard according to their needs and interests.
Filters can be global (applicable to the entire dashboard) or local (specific to a chart)
Ensuring comparisons
The ability to view two or more sets of data side by side
Alerts
Highlight information based on predefined criteria.
For example, an alert can be triggered if an indicator exceeds a certain threshold value.
Mistakes to avoid when creating a dashboard
•Starting with a far too complex dashboard (more prototyping, testing and tweaking is recommended).
•Using indicators that no one understands.
•Cluttering the dashboard with unimportant graphics and stylized elements that are difficult to interpret. The dashboard must remain simple (not simplistic!) and visually appealing
•Underestimating the time and resources needed to create the dashboard
•Lack of synchronization between included indicators and objectives.
•Use of ineffective graphics that have an uninspired design (3D, strong colors, pie charts with many categories).
•Sending fake messages with the dashboard. You need to make sure that the graphics don't send the wrong message that can be perpetuated
•Creating a false narrative based on the dashboard, creating false scenarios for users based on a misinterpretation of the data.
The best practices in creating a dashboard
1. Including the right indicators in the dashboard
Including the right indicators in the dashboard is essential
Indicators must be essential and relevant to the goals of the dashboard and to the context
2. Inclusion of visual elements
Dashboards must be easy to read and quick to interpret
The inclusion of tables with a lot of information will be avoided, as it makes it difficult to get the message across
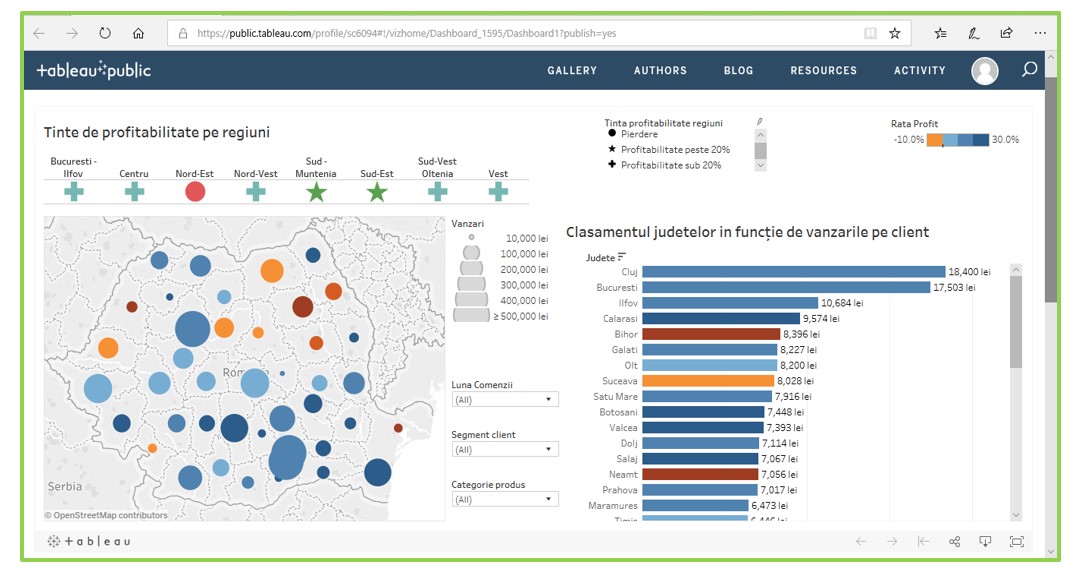
Elements of visual perception will be used such as: shapes, colors, lines, shades of colors, etc.
Avoid: 3D graphics, graphics that are not commonly used, overly stylized elements.
3. Inclusion of interactive elements
Dashboards need to be interactive, meaning users need to customize them to get the information they need. Interactive dashboards that contain many visual elements should allow the audience to perform basic analytical tasks, such as: filtering elements, drilling down information, or examining the data behind the graphs. Interactivity should be easily achieved with a minimum of training.
4. Keeping dashboard information current
5. The dashboard must be easy to access and use
 Play Audio


